Research
I am motivated by current scientific questions to develop general, principled methods for the analysis of data arising from neuroimaging studies. My work balances ideas from classification using machine learning and novel feature exploration in order to develop data analysis tools required to solve problems in structural imaging data sets in a clinically meaningful manner. Recently, I’ve been interested in developing statistical methods for multi-modal analysis to better characterize and understand neurodevelopment.
I have previously developed methods to advance automated lesion detection in multiple sclerosis. I have also applied statistical methods to functional neuroimaging data to quantify the pain network in the brain. Additionally, I worked in the statistical genetics field both in GWAS studies as well as gene based testing methods and pathway based testing methods.
Below are a few images stemming from my recent work:
Automatic Lesion Segmentation
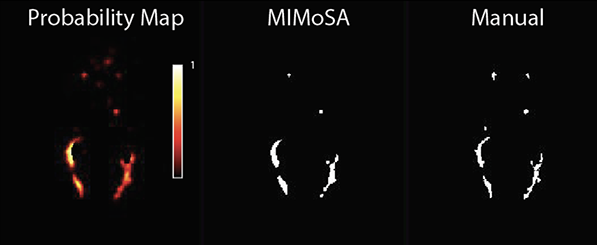
Multiple sclerosis is an inflammatory disease of the brain and spinal cord characterized by demyelinating white matter referred to as white matter lesions. The number and volume of lesions are essential for evaluating disease-modifying therapies and monitoring disease activity. The current gold standard approach for lesion classification is manual segmentation by a radiologist or other imaging scientist. Unfortunately, these methods are prone to a large amount of intra- and inter- observer variability. Automated segmentation reduces cost, variability, and time but remains challenging. The majority of statistical techniques for the automated segmentation of white matter lesions are based on a single imaging modality, but recent advances have used multimodal techniques for identifying white matter lesions. This motivated me to develop MIMoSA a machine learning algorithm which leverages features that capture not only the mean structure within an image but also the covariance structure between complementary MRI contrasts. MIMoSA was built to automatically segment T2 hyperintense lesions.
Our paper on this topic is available through the Journal of Neuroimaging here. Our methods are implemented as an R package mimosa, hosted on Neuroconductor and GitHub. You can download it here. For the most recent version, check out my GitHub repo here.
I extended the MIMoSA method to segment T1 hypointense lesions. T2 hyperintense lesions are non-specific to the level of multiple sclerosis tissue destruction and show weak correlations with clinical variables. T1 hypointense lesions are more specific to axonal loss and link closer with clinical covariates. Unfortunately, T1 hypointense lesions are very difficult to automatically segment since they present similarly to gray matter.
Our paper on this topic is published in the NeuroImage: Clinical journal here. The R package mimosa can be utilized to implement the methods.
Automatic Threshold Detection for Classification of Lesions
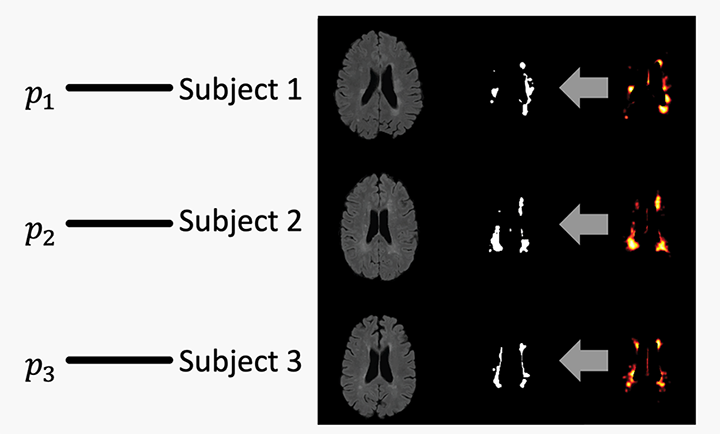
Total brain white matter lesion volume is the most widely established MRI outcome measure in studies of multiple sclerosis. To estimate white matter lesion volume, there are a number of automatic segmentation methods available. MIMoSA, described above, is just one of many automatic segmentation approaches that exist. Even with a number of automatic options, manual delineation remains the gold standard approach. Automatic approaches, including MIMoSA, often yield a probability map to which a threshold is applied to create binary lesion segmentation masks. Few approaches systematically determine the threshold employed; many methods use a manually selected threshold, thus introducing human error and bias into the automated procedure. To overcome some of these issues, I developed and validated an automatic thresholding algorithm, Thresholding Approach for Probability Map Automatic Segmentation in Multiple Sclerosis (TAPAS), to obtain subject-specific threshold estimates for probability map automatic segmentation of T2-weighted (T2) hyperintense white matter lesions.
Our paper on this topic is under review at NeuroImage: Clinical but you can find a draft on bioRxiv here. The R package rtapas can be utilized to implement the methods. You can download it from Neuroconductor here or the development version from GitHub here.
Multi-Modal Analysis and Neurodevelopment
My most recent work investigates structure-function relationships using multi-modal MRI to better understand neurodevelopment, aging, and pathology. Multi-modal MRI modalities quantify different, yet complimentary, properties of the brain and its activity. When studied jointly, multi-modal imaging data may improve our understanding of the brain. I aim to study the complex relationships between multiple imaging modalities and map how these relationships vary spatially across different anatomical brain regions. This work in ongoing. Check back later for a link to the paper and accompanying R package.
Game of Thrones
Warning: The content below contains spoilers for Game of Thrones and some foul language.
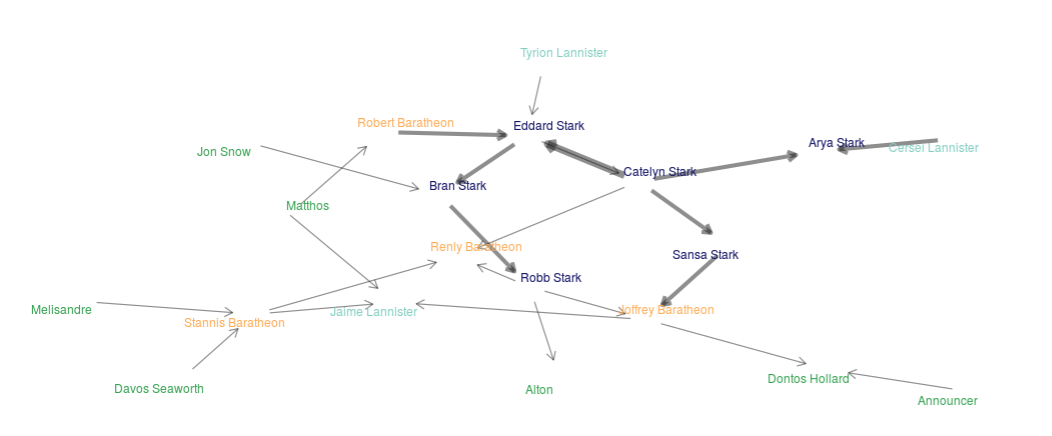
To deal with my deep and intense sadness resulting from a lack of a new Game of Thrones season in 2018 I decided to make a shiny app available at this link https://alval.shinyapps.io/got_shiny/. The app creates a network of the characters based on number of times a single character speaks another characters name using the TV scripts.
The top left corner of the app provides links to a Description and About page. Code is readily available through links on the About page in the app. This project was mostly a learning experience so I could teach myself dplyr, tidyr, shiny, and get a basic understanding of network analyses. If you’re interested in learning more details about the patterns found in the network using the app I wrote a blog post that can be accessed here.
In addition to the shiny app I played with some graphics to summarize the show. With the Game of Thrones TV scripts I also created a bar graph to display the number of lines spoken from the top 27 characters.
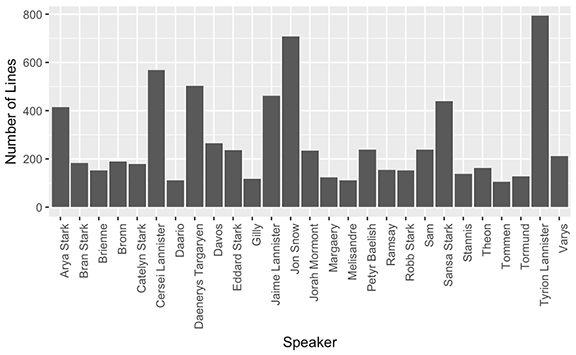
Unsurprisingly, Tyrion Lannister speaks the most lines in the show up to and including season 7. A somewhat more surprising result though, is that Eddard Stark is a top speaking character yet he died in season 1.
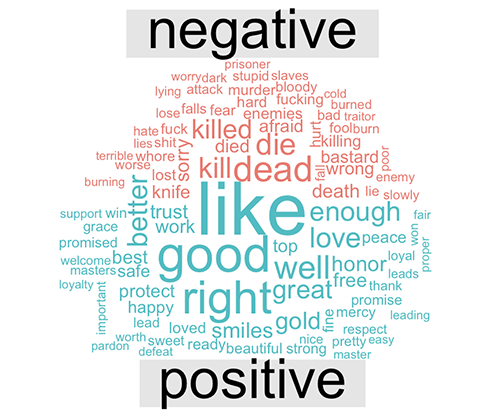
This graphic includes the most frequent words that appear in the Game of Thrones scripts and breaks them into positive and negative sentiment. The most frequent negative words used include kill, death, and words stemming from these but in different tenses. On the other hand, honor, protect, and free are some of the most commonly used positive words.
I developed an R package to aid in scraping the Game of Thrones TV script data. I discuss it in more detail on my software and GitHub pages.